When you’re designing protective foam packaging, every inch matters. The goal is simple: use just enough foam to protect your product without wasting material and adding unnecessary cost.
That balance depends on one powerful tool: the cushioning curve. Understanding it helps engineers and procurement specialists determine the ideal material, thickness, and density to protect products during shipping.
Related Content: Data-Driven Protection: Why Foam is the Science-Backed Choice
What is a Cushioning Curve?
A cushioning curve shows how a foam material at a specific thickness responds to impact. In simpler terms, it tells you how much shock a material can absorb before your product takes damage.
In the packaging world, this data helps determine the minimum foam thickness needed to keep a shipment safe while minimizing cost. Different foam types have their own unique curves, depending on their density, composition, and structure.
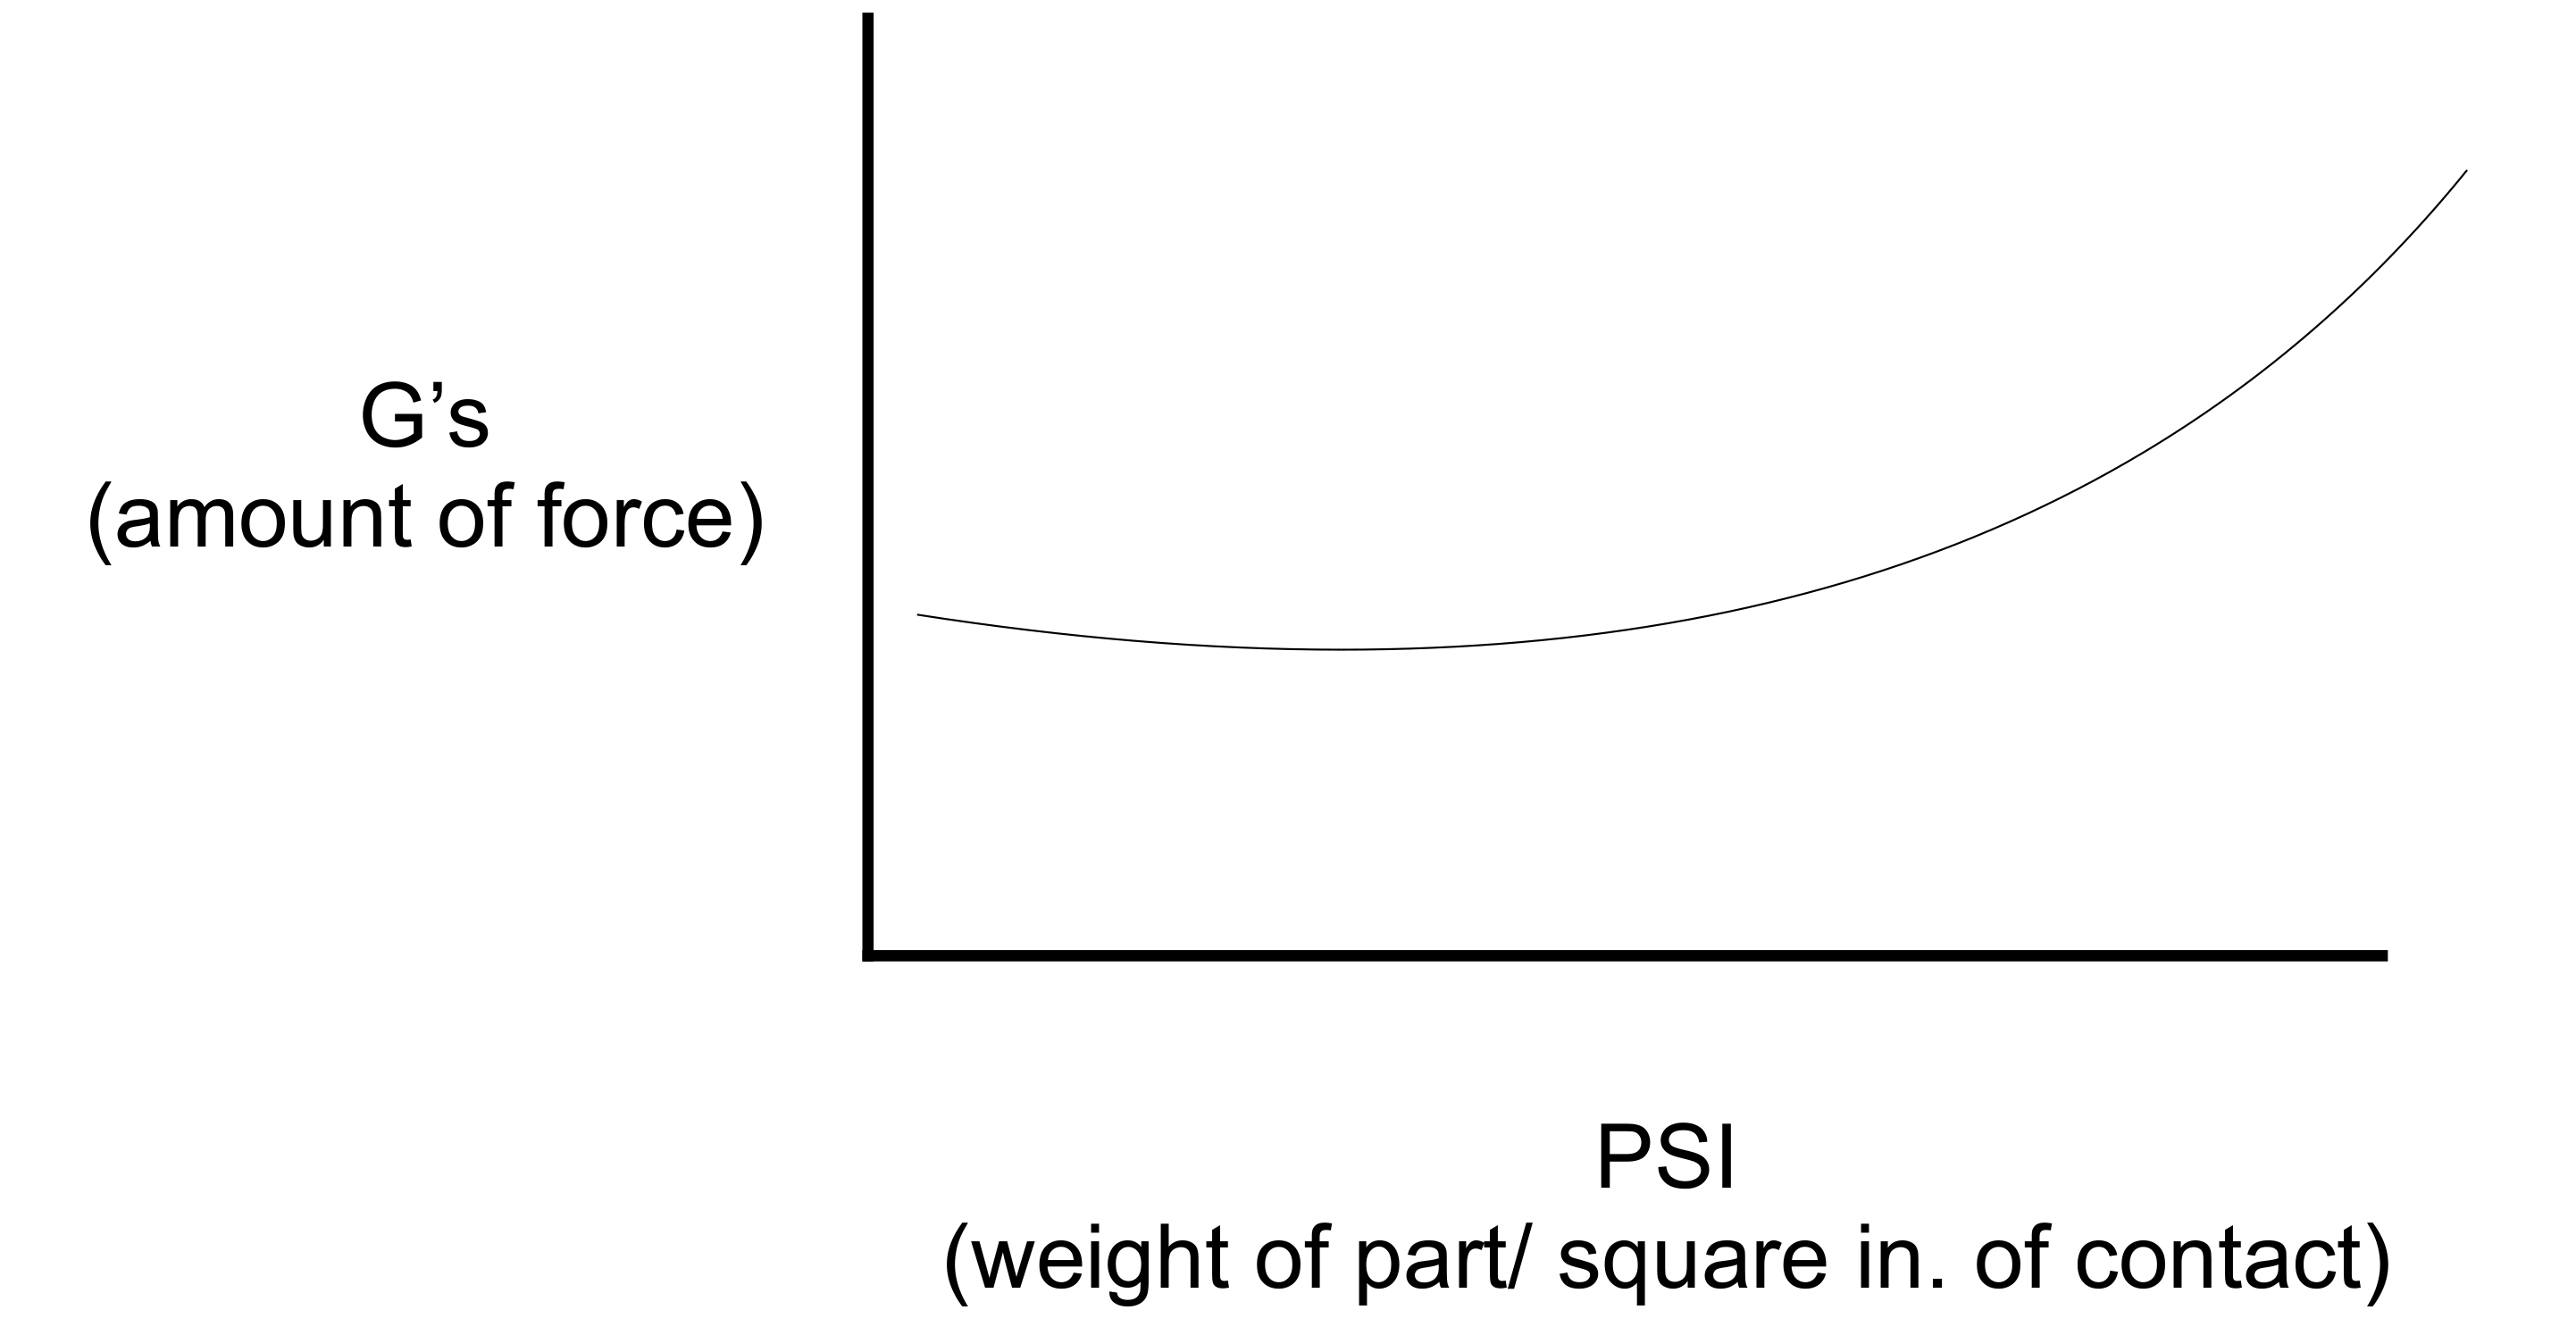
A sample cushioning curve showing the relationship between G-force and PSI.
Think of it as a test: how high can a package fall — or how hard can it hit — before something breaks inside? When you know that, you can design packaging that protects against real-world drops, not just theoretical ones.
How Cushioning Curves are Calculated
To create a cushioning curve, engineers use three main data points:
- Product weight
- Maximum G-force the product can withstand before damage
- Shipping environment (how high the item might be dropped, handled, or stacked)
These numbers are plotted on a graph where the vertical axis represents G-force (impact energy) and the horizontal axis represents PSI (pounds per square inch), calculated by dividing product weight by foam surface area.
Each plotted line shows how the foam performs at different stress levels. By comparing these results, you can find the “sweet spot” where protection is highest with the least material used.
Example Cushioning Curve in Action
Let’s say you’re shipping a 10-pound component.
If you use 10 square inches of foam, the part experiences around 40 G’s of impact. But if you use only 5 square inches, that impact jumps to 60 G’s.
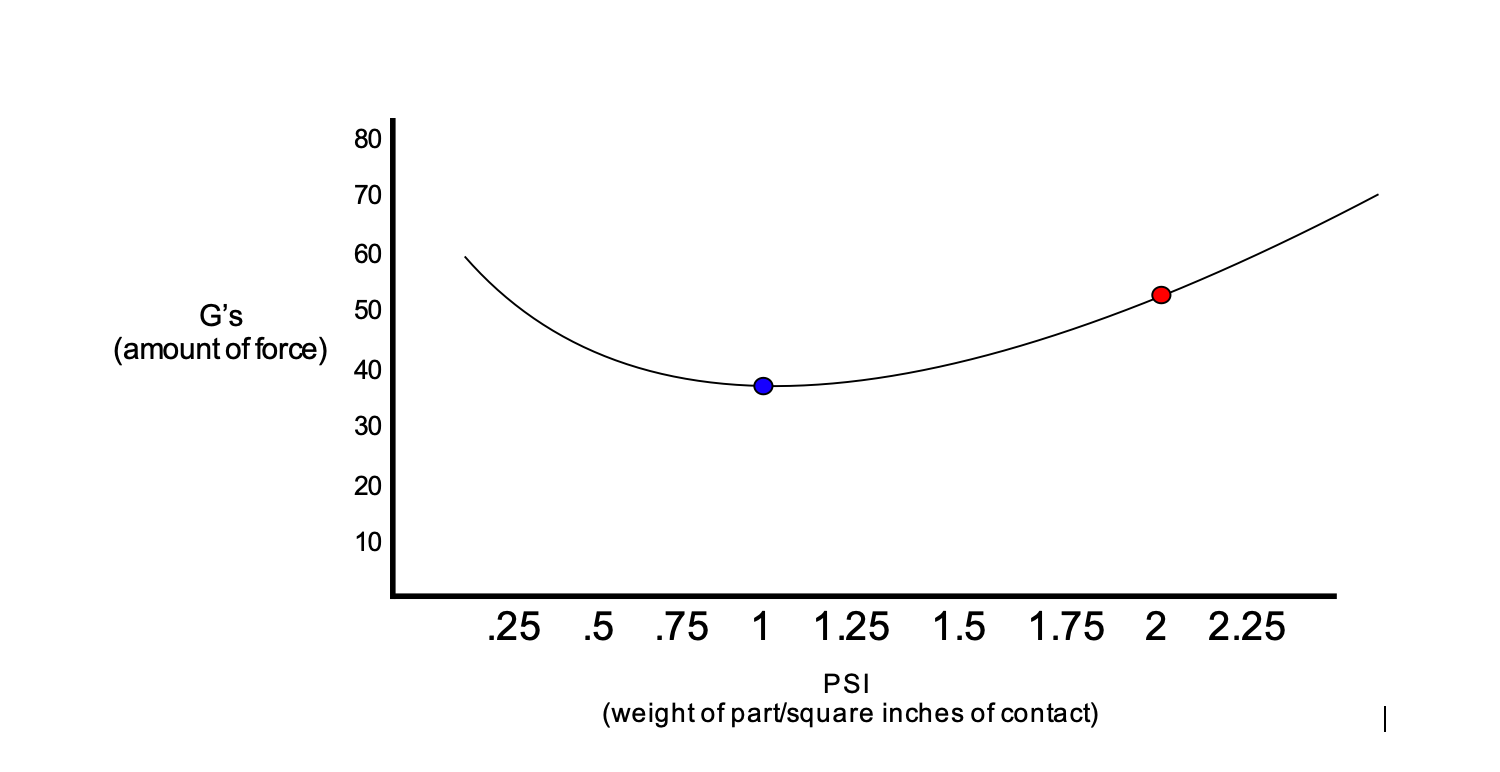
Blue: 40 G’s at 10 in². Red: 60 G’s at 5 in².
As long as the plotted point stays below the product’s damage threshold, the packaging is sufficient. This is why cushioning curves are crucial: they let you quantify protection instead of guessing.
Cushioning Curve vs. Tensile Strength vs. Tear Strength
Cushioning curves measure impact performance, but that’s just one piece of foam behavior.
- Tensile strength shows how much force a material can take before breaking.
- Tear strength shows how easily a material rips once damaged.
Both affect how foam performs over time and under stress. To learn more, check out our related article: Tensile Strength vs Tear Strength for Foam Packaging.
How to Use Cushioning Curves When Selecting Foam Material
Every shipping environment is different. A laptop may be dropped from four feet, while a refrigerator rarely leaves the ground. Foam materials have distinct cushioning curves for different drop heights and thicknesses — typically 1”, 2”, 3”, and even 5”.
The right curve helps engineers and buyers:
- Minimize excess material while keeping shipments safe
- Select foam densities that balance cost and protection
- Reduce returns and product damage from under-performing packaging
When applied correctly, cushioning curves let you design smarter, not bulkier, packaging.
The physics and math behind cushioning curves can be complex, but Foam Industries handles that for you. Our team combines engineering expertise with decades of experience in foam fabrication to deliver custom protective packaging that performs exactly as tested.
We design, prototype, and fabricate packaging that protects your products, saves on shipping costs, and supports your brand presentation.
Get It Right - Work with a Foam Packaging Expert
Fortunately, you don’t have to worry about the hefty calculations we’ve outlined above with the help of Foam Industries. As a leader in the packaging industry, Foam Industries has set the bar with an unwavering commitment to quality, exceptional client service, and constant innovation. Through our extensive inventory of endlessly customizable products, we ensure you find exactly what you’re looking for.
Foam Industries is a custom protective packaging company specializing in foam – with additional wood and plastic fabrication services. Our custom foam fabrication services are ideal for any type of packaging, display, or support service needed – from design to finished product.